Inside $4.34 billion in Morpho vaults
Data note: This analysis uses an October 9, 2026 snapshot. Rates, allocations, rewards and grades may have changed since then. For current data on covered vaults, visit the DD.xyz vault dashboard or access Webacy’s APIs.
On October 9, seven of the largest Morpho vaults supplied about $1.45 billion to a single lending market on Base. Together, they accounted for 84.7% of that market’s supplied capital, despite having different names and curators.
A vault’s headline rate tells an allocator little about who pays the yield, where deposits are deployed or what determines the ability to withdraw. Those questions require looking through the vault to its underlying markets, collateral, incentives and funding.
We analyzed the sixteen largest Morpho vaults by total value locked (TVL) as of October 9, 2026, using Webacy’s vault risk data alongside public onchain and governance records. The sample held about $4.34 billion, including Steakhouse’s USDG vault on Robinhood Chain. Three findings stood out:
- Shared markets. Five of the seven vaults supplying the Base cbBTC/USDC market allocated at least 90% of their capital to it.
- Reward-dependent rates. Incentives accounted for roughly 38% to 57% of the displayed rate in the three vaults with the highest headline rates.
- Concentrated share holdings. Four vaults holding about $920 million combined had at least 98% of their shares at a single address in each vault.
These findings show dependencies that a headline rate cannot explain. For allocators, the useful question is how those dependencies affect a position and the rest of the portfolio.
Different vaults, same market
Morpho vaults allocate deposits to lending markets selected by their curators. Examining those allocations reveals how much exposure different vaults share.
The clearest overlap in the sample was the cbBTC/USDC market on Base. The seven vaults supplying it accounted for 84.7% of its supplied capital. Their combined allocation to this market represented 33.4% of the sample’s total TVL. Five allocated at least 90% of their capital to this one market.
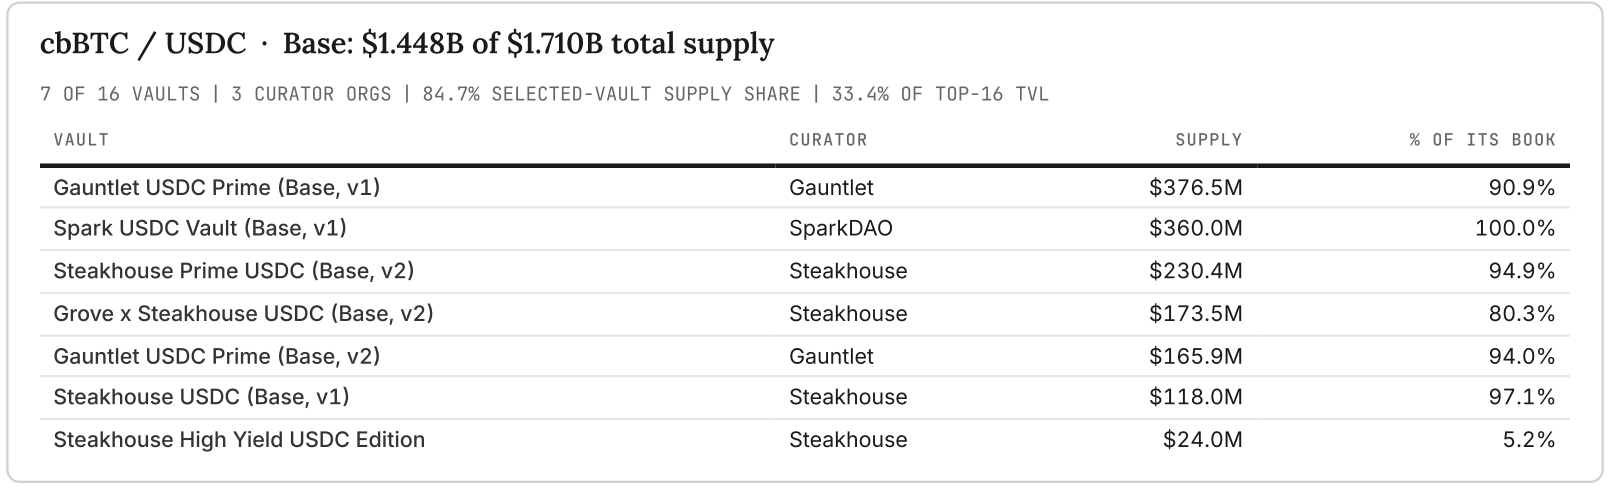
Seven vaults supplied the same Base lending market on October 9. Five allocated at least 90% of their capital to it; Grove x Steakhouse allocated about 80%.
An allocator could hold several of these vaults, each with different curators and fees, while retaining substantial exposure to one lending market. A sharp move in collateral prices, an oracle failure, unsuccessful liquidations or a liquidity shortage could affect several positions at once, in proportion to their exposure.
Separate vaults can serve different clients, mandates and allocation policies. Assessing diversification still requires checking where their underlying exposures overlap.
The collateral also matters. USDC lent against cbBTC depends on the value of that collateral and on the oracle and liquidation mechanisms used to protect lenders.
Across twenty-five markets, a single vault from the sample supplied at least 95% of each market’s total supplied capital. The sample’s allocations to those markets totaled about $1.97 billion, or 45.5% of its TVL. Sentora PRIME Main, for example, allocated 98% of its capital to PRIME/PYUSD and supplied that market in full.
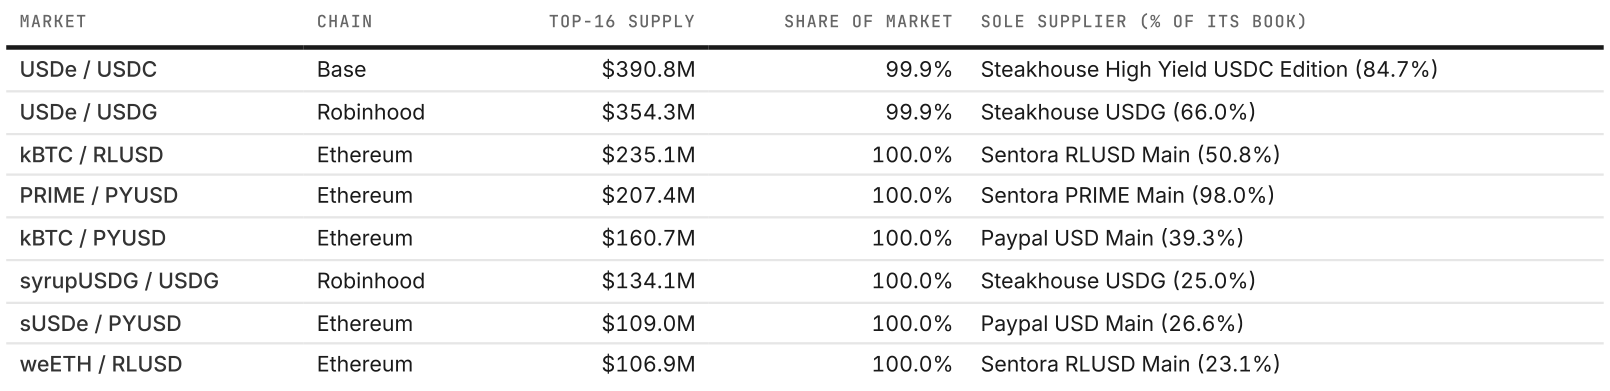
The eight largest markets where one vault supplied at least 95% of the capital on October 9. Supplier concentration alone does not establish withdrawal liquidity.
A dominant supplier’s results depend heavily on the borrowers and collateral in that market. Those exposures need to be assessed alongside the size of the allocation.
Who’s behind the money
The loans show where a vault earns its return. The other half of the picture is who put the money in.
Across all sixteen vaults, the median share held by the largest address was 40.1%. Seven vaults had one address holding more than half of their shares, and nine had at least 80% held by their top ten addresses.
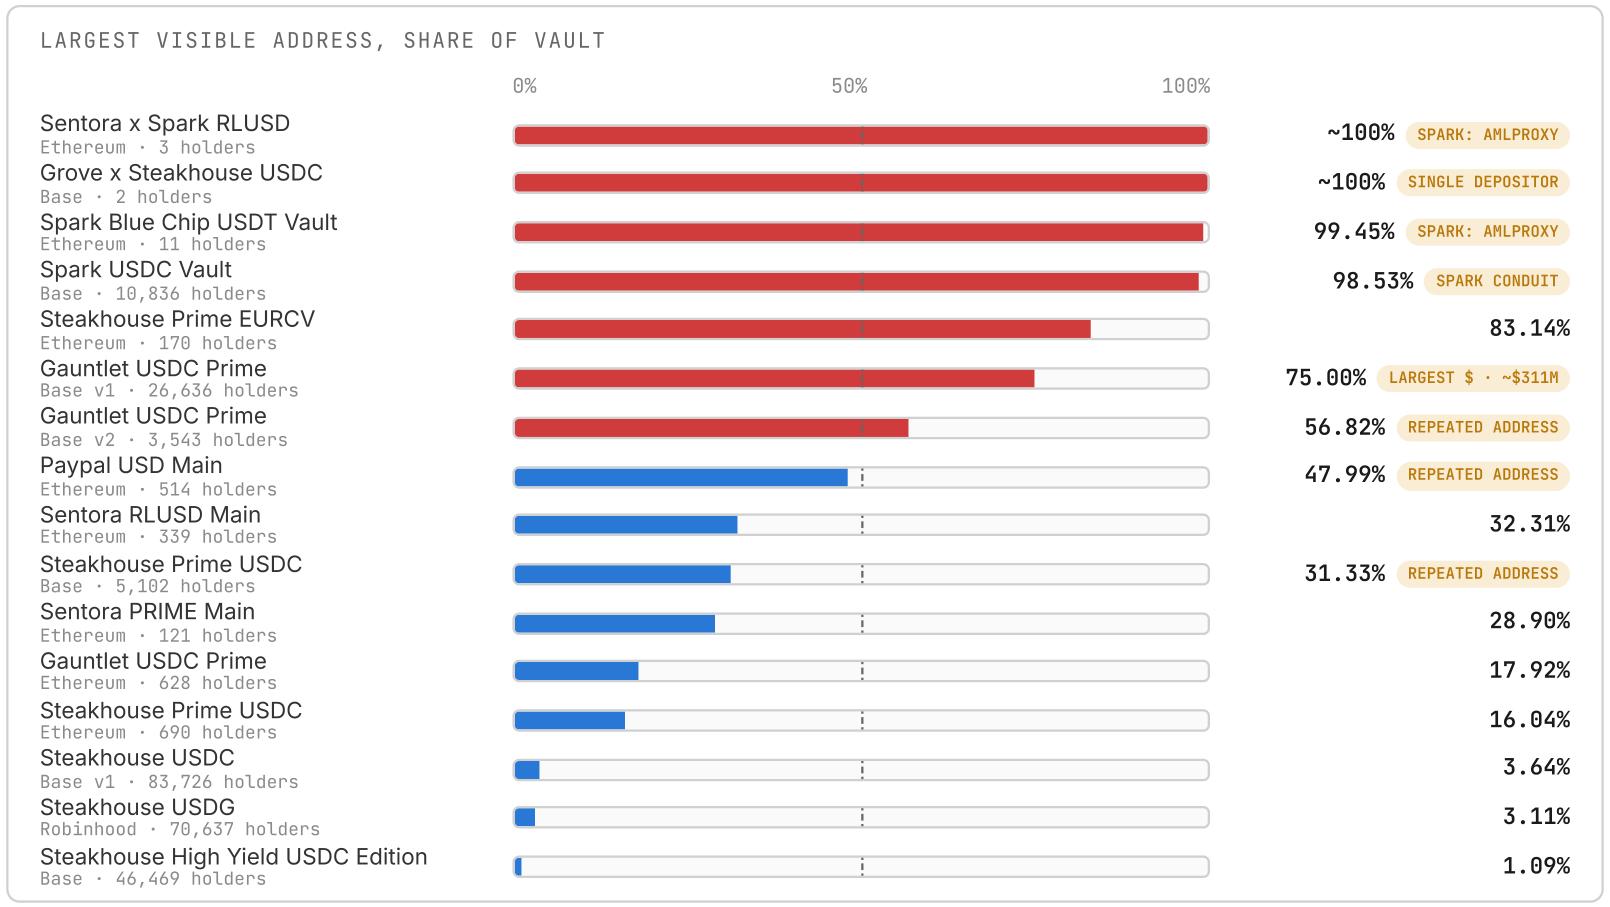
Largest visible address as a share of each vault on October 9. An address may represent a protocol, custodian, managed vehicle or many underlying users.
An address isn’t a person. A large holder may be a protocol contract, custodian, fund or product serving many underlying users. Address concentration needs to be interpreted in that context.
Four vaults, with about $920 million in combined TVL, had at least 98% of their shares at one address each. Three dominant addresses were identified as Spark contracts. The fourth vault, Grove x Steakhouse USDC, held about $216 million across just two holder addresses.

About $920 million was held in four vaults with at least 98% of shares at one visible address each. Address concentration does not establish beneficial ownership.
Grove’s case has a simple explanation. Its main holder, 0x9B74...eCEe, appears in Sky’s January governance records as Grove’s ALM Proxy on Base, the contract it uses to hold and deploy capital. September onboarding documentation then names this exact vault as a new destination for Grove’s USDC allocation, replacing an older Base vault. Grove routes its allocation through one contract, so that’s where the shares sit.
Spark’s documentation describes the same setup: capital sits in an ALM Proxy and is deployed to approved venues through controllers. Governance records name Sentora x Spark RLUSD and Spark Blue Chip USDT as destinations, so a single dominant holder there matches that structure.
Another address, 0x2bf5...f67c (Etherscan, Basescan), held about $483 million across four vaults run by three different curators. It was the largest holder in three and the second largest in the fourth. This created a shared funding dependency across the four vaults, although a withdrawal from one would not require a withdrawal from the others.
LlamaRisk’s September assessment identifies this address as a holding wallet for USDe backing positions across Sentora, Gauntlet and Steakhouse vaults. We haven’t independently verified that attribution.
Identifying the holder makes the concentration easier to assess. Who controls the allocation? What limits apply? What circumstances could lead that holder to withdraw?
Withdrawals are a separate question
Withdrawal capacity depends on the liquidity available when a request is made. This analysis did not measure executable withdrawal liquidity. A market with one dominant supplier can have substantial unborrowed capital, while a widely held vault can have limited immediate liquidity when utilization is high. Receiving an underlying position also differs from receiving the deposited asset.
Grove x Steakhouse USDC and Sentora x Spark RLUSD were set up, per their published onboarding terms, with unlimited withdrawal rate limits for Grove and Spark. Those terms remove a rate cap on their withdrawals; they don’t show that the cash is available when a withdrawal is requested.
How much of the rate comes from lending?
A displayed vault rate can include borrower interest and incentives distributed through reward campaigns. Fees also affect the depositor’s return. Comparing reported rates with and without rewards helps separate these sources.
That distinction changed the rankings in this sample. Sentora PRIME Main, Sentora RLUSD Main and PayPal USD Main had the three highest headline rates. Excluding rewards, they ranked ninth, thirteenth and fourteenth.
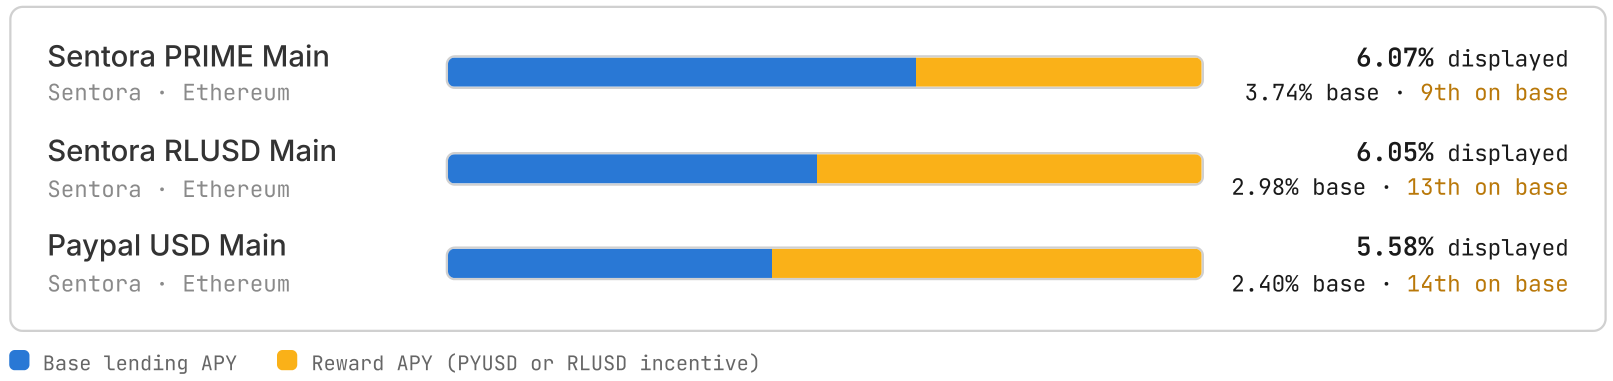
Reported Morpho rates at the October 9 snapshot. Blue is the rate excluding rewards; yellow is the reward portion.
At the snapshot, Sentora PRIME Main showed 6.07%, or 3.74% excluding rewards. Sentora RLUSD Main showed 6.05%, or 2.98%. PayPal USD Main showed 5.58%, or 2.40%. Rewards made up roughly 38%, 51% and 57% of those rates.
Borrower interest and reward payments have different drivers and can change independently. Separating them helps allocators assess how much of a displayed rate depends on continued incentives.
For comparison, Gauntlet USDC Prime on Base v1 and Grove x Steakhouse USDC both showed 4.65% excluding rewards, rounded to two decimal places. Removing incentives materially changed how the vaults ranked by reported rate.
An annual rate can rest on a one-week campaign
Merkl campaign data adds a funding period to the annualized rate. At the snapshot, the three vaults with the highest headline rates had campaigns totaling about $547,000 for October 8 to 15, created by addresses attributed to Sentora. Campaign creation identifies the creator; it does not, by itself, establish the ultimate funding source.

Full-week campaign budgets and reward rate caps reported through Merkl. These are total budgets, not what was left on October 9. Dollar totals assume the stablecoins are worth about $1.
Extrapolating that one week’s budget across a full year gives roughly $28 million annualized. Applying Morpho’s displayed reward rates to vault TVL gives about $32.2 million. Both figures are annualized run rates. The campaigns shown here covered October 8–15; these calculations do not establish a full-year reward commitment.
The reported rates also differed by source. Sentora RLUSD Main’s reward rate ranged from about 2.7% to 3.3% at the snapshot, with a 3.9% cap. These figures use different measurement bases. A rate cap sets a maximum; it does not establish the rate every depositor receives.
The campaign data recorded 96 campaigns across these three vaults, indicating repeated incentive activity. Assessing the durability of the October 9 rates would require checking subsequent renewals, budgets, caps and eligibility. This analysis does not establish whether the campaigns ending October 15 were renewed.
Reading the grades alongside the exposures
Fifteen of the sixteen vaults carried Webacy grades at the snapshot, ranging from A- to A+. Steakhouse USDG was outside grading coverage. Similar overall grades can accompany different allocations, concentrations and sources of yield. The underlying risk breakdown helps explain those differences.
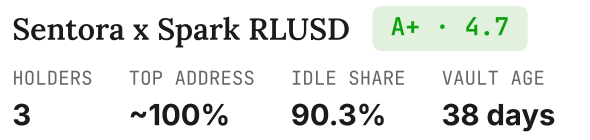
Sentora x Spark RLUSD at the snapshot: A+, a 4.7 risk score and 90.3% of its money idle. A lower risk score means lower assessed risk.
Sentora x Spark RLUSD illustrates why allocation context matters. It held about $250 million in TVL across three holder addresses, with about $226 million, or 90.3%, idle. Only $24.3 million was deployed in a WBTC/RLUSD market, alongside a displayed rate of 0.14%. Its A+ grade and 4.7 risk score described the assessed position at that snapshot; future deployments would change the exposures requiring review.
Idle capital still carries asset, contract and control risk. As capital moves into lending markets, monitoring needs to reflect the new collateral, counterparties and market conditions.
Steakhouse USDG showed a different combination of exposures. At about $537 million, it was the largest vault in the sample, with more than 70,000 holder addresses and about 3.1% of shares at the largest address. Its share holdings were comparatively dispersed, while 66% of its capital was allocated to a single USDe/USDG market. It was also outside Webacy’s grading coverage at the snapshot. Holder distribution, lending concentration and grading coverage answer separate questions.
Portfolio analysis adds another layer. Several highly rated vaults can share a market, collateral asset or funding address. Allocators need to assess those relationships across their holdings. An unrated vault requires further diligence; the absence of a grade does not establish its risk level.
What requires ongoing monitoring
The snapshot identified several conditions to track over time:
- Renewals, budgets, caps and eligibility for reward campaigns, including those scheduled to end October 15
- Deployment of the RLUSD held idle by Sentora x Spark at the snapshot
- Utilization and borrower health in Base cbBTC/USDC
- Large moves by the dominant and repeated holder addresses
- Collateral, oracle and allocation changes in these markets
Each change needs to be assessed in context. An incentive campaign ending changes the source of return. A new allocation changes the vault’s exposures, even when its overall grade moves little.
Evaluating vault yield requires tracing the rate to its funding source, understanding the exposures behind it and assessing withdrawal conditions. That work continues as allocations, incentives and liquidity change.
Webacy provides real-time onchain risk intelligence for this work, with risk breakdowns for covered vaults on the DD.xyz vault dashboard and access through our APIs. Explore the dashboard, review the API documentation or contact us to discuss incorporating the data into your diligence and monitoring workflows.
Methodology: This analysis uses an October 9, 2026 snapshot of the sixteen largest Morpho vaults by TVL. Figures reflect Webacy vault data, reported Morpho rates, Merkl campaign data and the public records linked above. Grades reflect Webacy’s coverage at the snapshot. Holder figures represent visible onchain addresses and may include protocols, custodians and pooled products. We did not measure executable withdrawal liquidity, check live rate-limit settings or test withdrawals, and third-party address attributions were not independently verified. Annualized rates and campaign run rates do not establish future returns or a full-year funding commitment.
This article is for educational purposes and illustrates how Webacy data can support onchain due diligence. It does not constitute investment advice or a recommendation to invest in or avoid any vault.
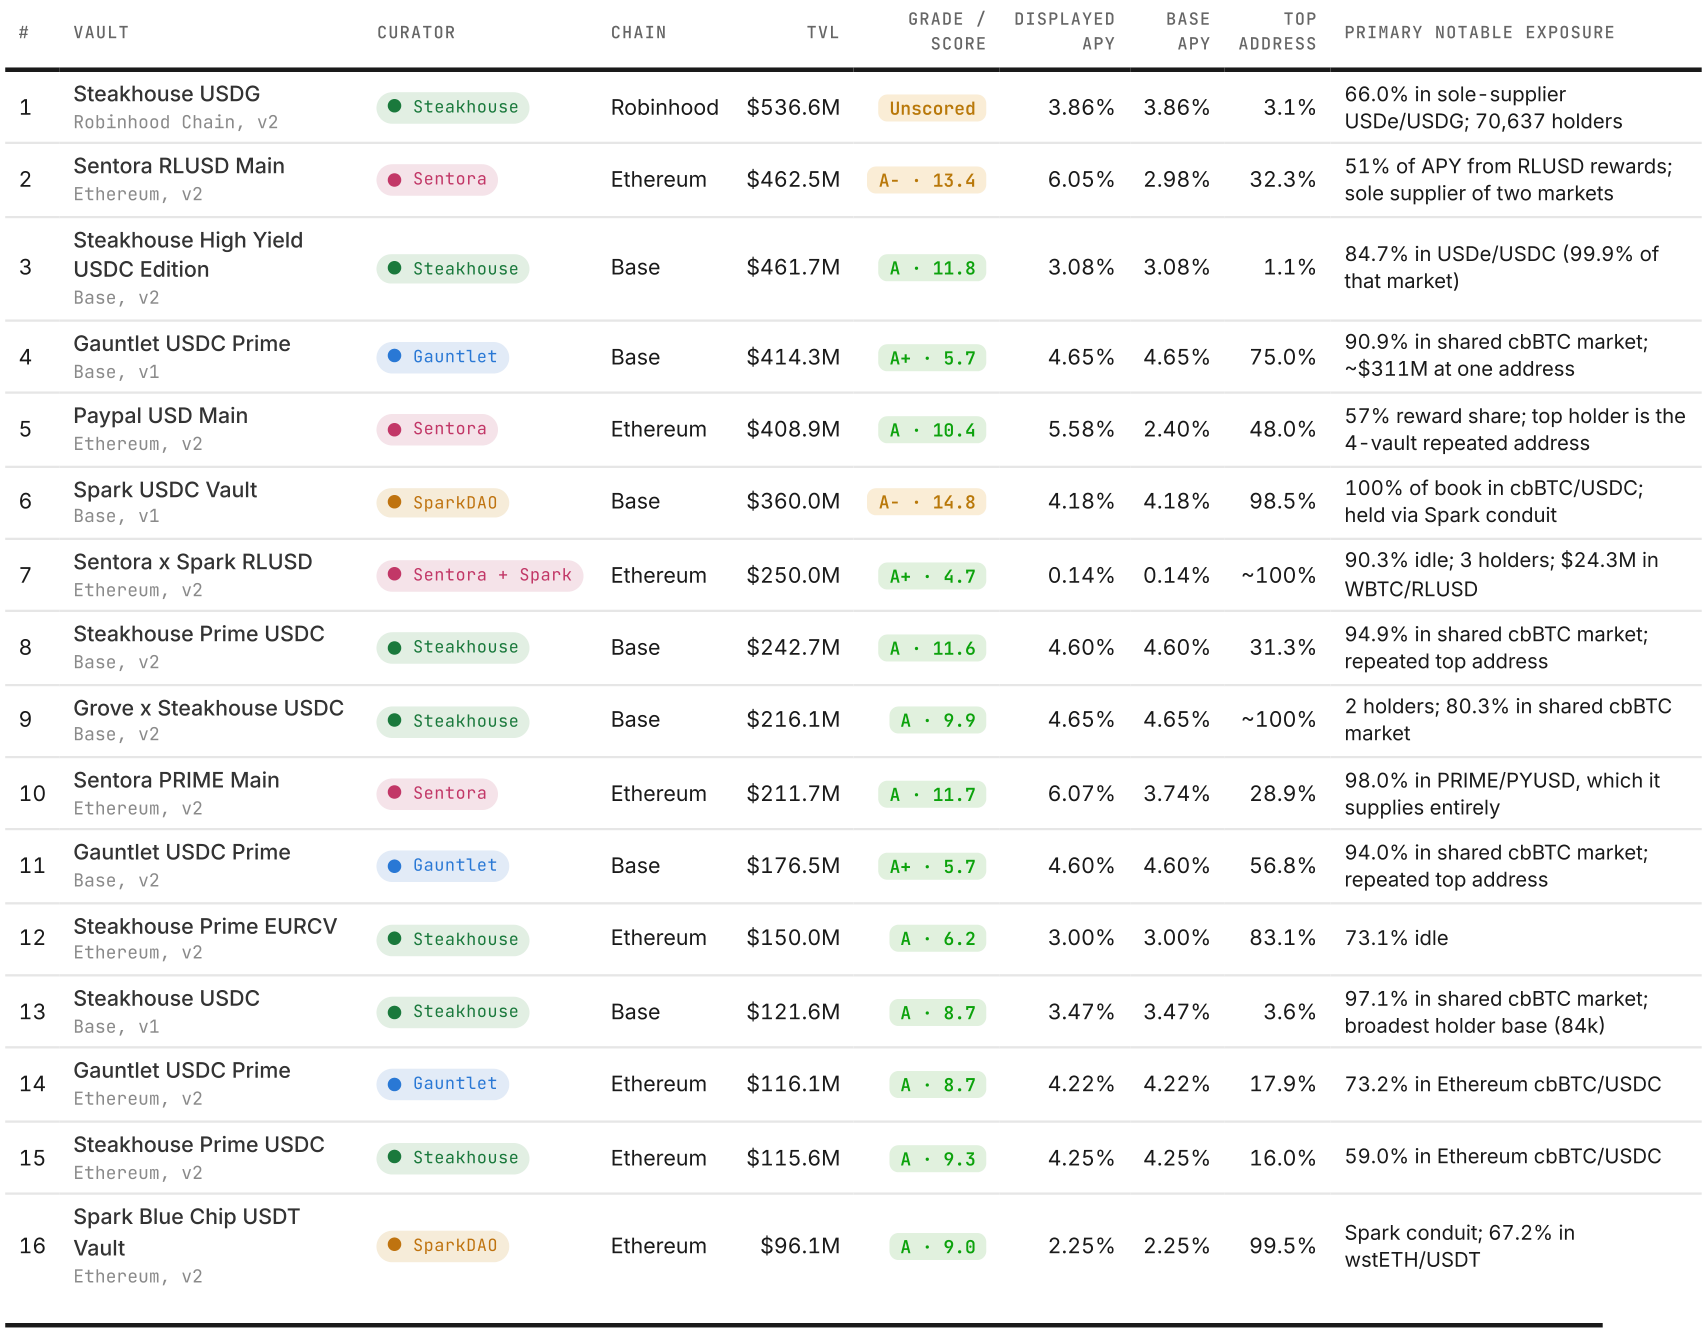
The full vault snapshot
The October 9, 2026 comparison of all sixteen vaults. In this table, “Base APY” means the reported rate excluding rewards; it does not refer to the Base chain. Top-address percentages reflect visible share holdings, including protocol contracts.